ECON102 Study Guide
Unit 3: Unemployment and Inflation
3a. Define unemployment rate
- Define employed and unemployed.
- Define labor force. Name some examples of the types of people who are part of, and outside the labor force.
According to the U.S. Bureau of Labor Statistics, individuals are unemployed if they are not working, but available, and actively looking for a job. For economists, the unemployment rate provides a key measure for how well the economy is doing. The unemployment rate details the percentage of adults who are part of the labor force who do not have a job, not the percentage of every person who is not officially employed. So for example, the unemployment rate does not include children, retirees, full-time students, people who work from home and do not earn a salary, volunteers, and people who are not actively seeking employment.
You need to calculate the total labor force to calculate the unemployment rate.
Unemployment rate = Unemployed people / Total labor force × 100
This figure helps identify unemployed members of the labor force.
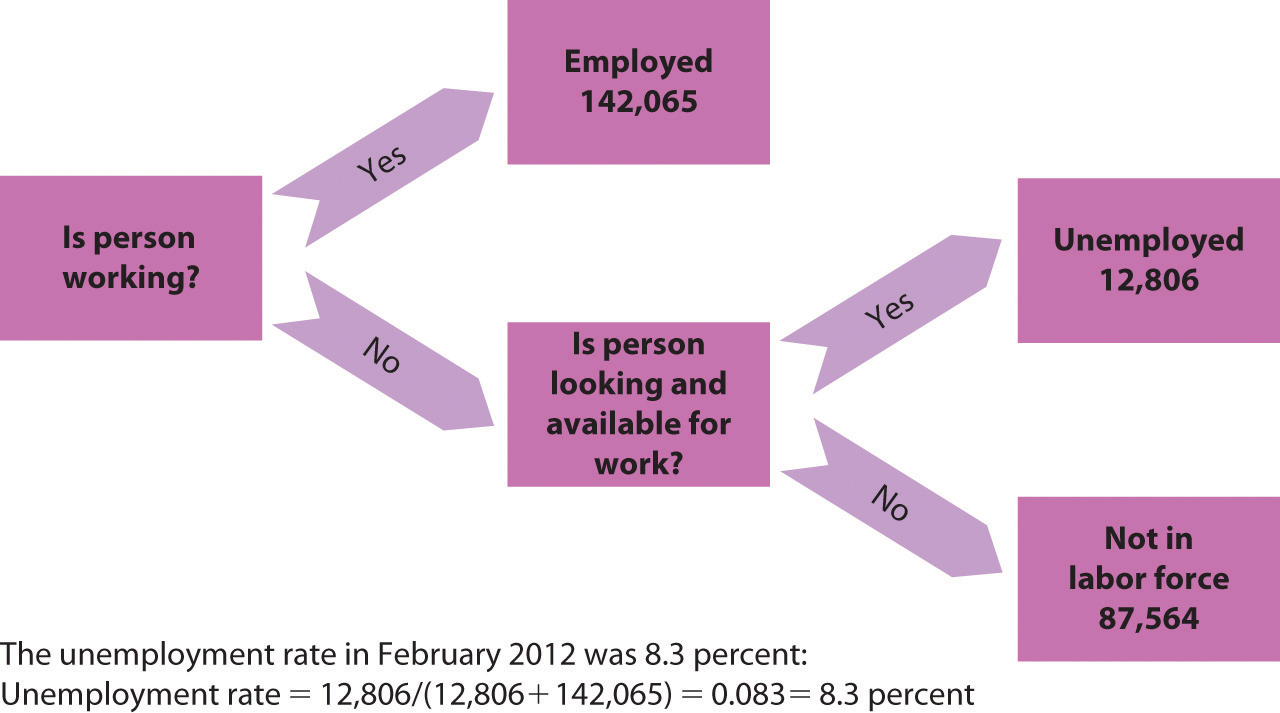
Computing the Unemployment Rate
To review unemployment, see:
- Unemployment
- Unemployment
- Unemployment
- Full Employment
- Unemployment Rate Primer
- Unemployment Rate
- Unemployment and Underemployment
3b. Calculate the unemployment rate
Review how to calculate the unemployment rate in learning outcome 3a above.
3c. Identify and distinguish between the different forms of unemployment
- Define frictional, structural, and cyclical unemployment.
- Explain whether these three types of unemployment are good, acceptable, or undesirable.
- Which type of unemployment indicates the economy is performing poorly and may need a correction?
- Can an economy achieve a zero unemployment rate?
- Define natural employment level or full employment.
Economists distinguish three types of unemployment: frictional, structural, and cyclical unemployment.
To review the different forms of unemployment, see:
- Unemployment
- Unemployment
- Unemployment: Types, Kinds, and Quantities
- Types and Measures of Unemployment Quiz
3d. Analyze the problems associated with the unemployment rate
- Name some imperfections in the process the U.S. Bureau of Labor Statistics uses to measure unemployment.
- Define hidden unemployment, underemployment, and what economists mean when they refer to discouraged workers.
- What factors cause the unemployment rate to overstate the true level of unemployment?
- What factors cause the unemployment rate to understand the true level of unemployment?
As with many policy calculations, the unemployment rate provides an imperfect measure of the economy. The unemployment rate may understate or overstate real unemployment in the economy.
3e. Describe the three types of unemployment and factors that relate to them
Review these three types of unemployment (cyclical, frictional, and structural) in learning outcome 3c above.
3f. Define inflation and deflation, and explain how each affects the price and economic growth of an economy
- Define inflation, deflation, and hyperinflation.
- Explain why an economy can experience a period of inflation while some prices are falling.
- Does an economy experience inflation when prices have been high for a long time?
- Explain how inflation, deflation, and hyperinflation can negatively impact borrowers, lenders, retirees, and the general economy.
Inflation refers to a rise in the average price level. Deflation describes a fall in the average level of prices. Governments aim to steer their economies toward a steady, one or two percent inflation rate, rather than zero percent.
To review inflation and deflation, see:
- Price-Level Changes
- Inflation
- Introduction to Inflation
- Hyperinflation
- Economic Commentary on the Costs of Inflation
- Macroeconomics/Inflation: The Role of Inflation in the Economy
- Bestiary of Behavioral Economics: Money Illusion
3g. Define, interpret, and calculate inflation rate and the consumer price index
- Define consumer price index (CPI), producer price index (PPI), GDP deflator (or implicit price deflator), employment cost index, and international price index.
- What specific baskets of goods do each of these price indexes measure?
- Define base period and the value of an index in the base period.
Economists use various price indexes to calculate and compare price fluctuations for specific baskets of goods and services during specific time periods. The three primary price indexes economists in the United States use include: the consumer price index (CPI), producer price index (PPI), and the GDP deflator (or implicit price deflator).
Review these steps for calculating the inflation rate.
- Identify the basket of goods you want to use to calculate the inflation rate. For example, for the consumer price index (CPI) you need to identify the specific goods and services a typical consumer buys, such as specific foods, gas, or clothes.
- To calculate the cost of the basket of goods and services for the base and current years, multiply the price of each good by its quantity and add all of the goods and services in the basket.
- To calculate the price index, divide the cost of the basket in the current year by the cost of the basket in the base year.
- To calculate the rate of inflation, take the percentage change in the cost of the basket or the percentage change in the price index.
To review these calculations, see:
3h. Describe the problems and biases associated with the consumer price index
While a consumer price index (CPI) provides a useful measure of inflation, as with all economic variables, it has some limitations. Think about the following sources of bias for the consumer price index.
- Since economists calculate indexes based on a fixed basket of goods and services, they do not account for substitutions consumers use when prices change.
- Companies frequently offer consumers new goods, services, and innovations that are not included in the baskets the economists study.
- Price increases could reflect quality improvements manufacturers make to their goods and services, that we should attribute to economic growth, not inflation.
- Price decreases could reflect a choice consumers make to shop at different locations (such as online) to obtain lower prices that should not be attributed to deflation.
To review some techniques the U.S. Bureau of Labor Statistics uses to overcome the issue of substitutions, new products, and biases when calculating the consumer price index (CPI), see Inflation and Price-Level Changes.
3i. Articulate sources of inflation, and explain how they can affect economic stability
- Define demand-pull inflation and cost-push inflation.
To identify sources of inflation, consider the demand and supply framework where companies determine equilibrium price and quantity. A shift in demand to the right or a shift in supply to the left will increase prices.
Review demand-pull and cost-push inflation in Demand-Pull Inflation under Johnson and Cost-Push Inflation.
3j. Use the model of aggregate demand and aggregate supply to explain stagflation
- Define stagflation.
Stagflation occurs when a recession and inflation occur at the same time – a highly undesirable situation. We study aggregate demand and aggregate supply in more detail in Unit 4.
To review, see Stagflation.
3k. Explain the relationship between inflation and unemployment
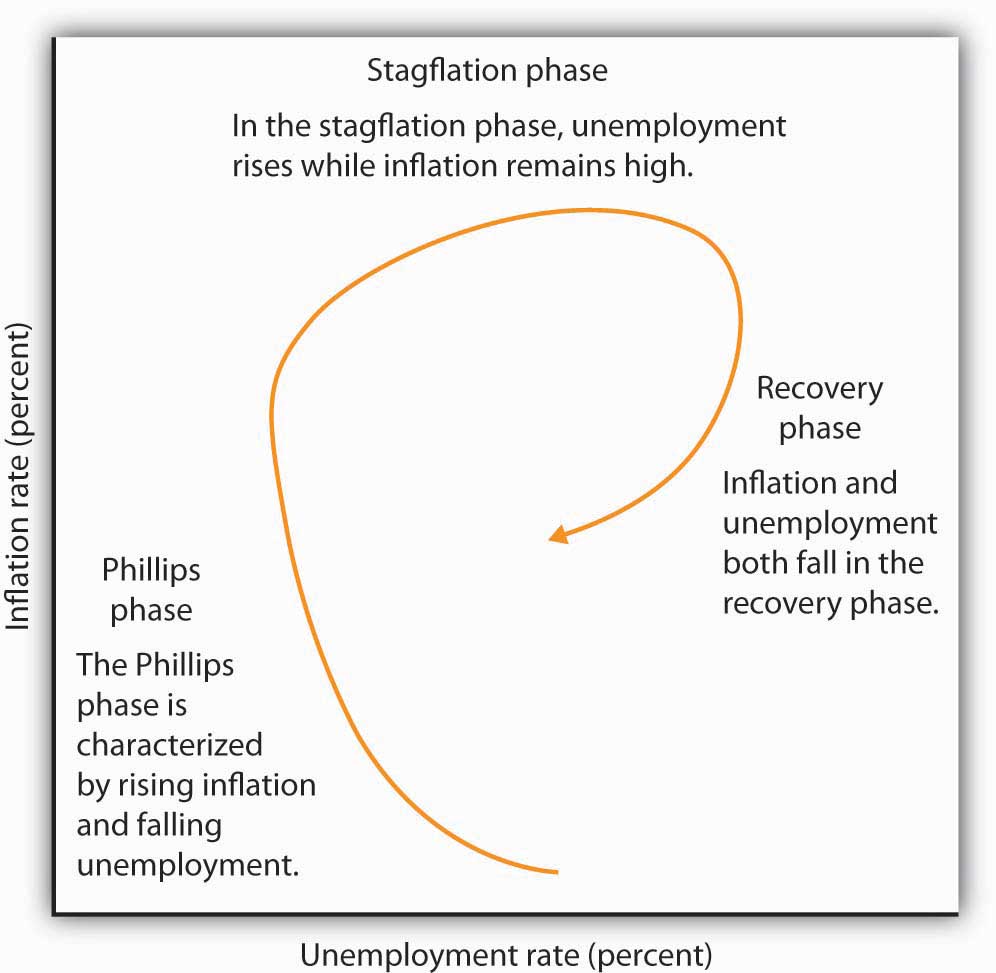
- Define the Phillips phase. Under what economic circumstances is it likely to occur?
- Define the stagflation phase. Under what economic circumstances is it likely to occur?
- Define the recovery phase. Under what economic circumstances is it likely to occur?
- How and why does the economy transition between phases?
The Short-Run Phillips Curve
In 1958, A. W. Phillips, a New Zealand economist, suggested that an inverse relationship exists between inflation and unemployment. In other words, a high inflation rate is associated with a low rate of unemployment and vice versa. This theory provides the basis for the Phillips curve.
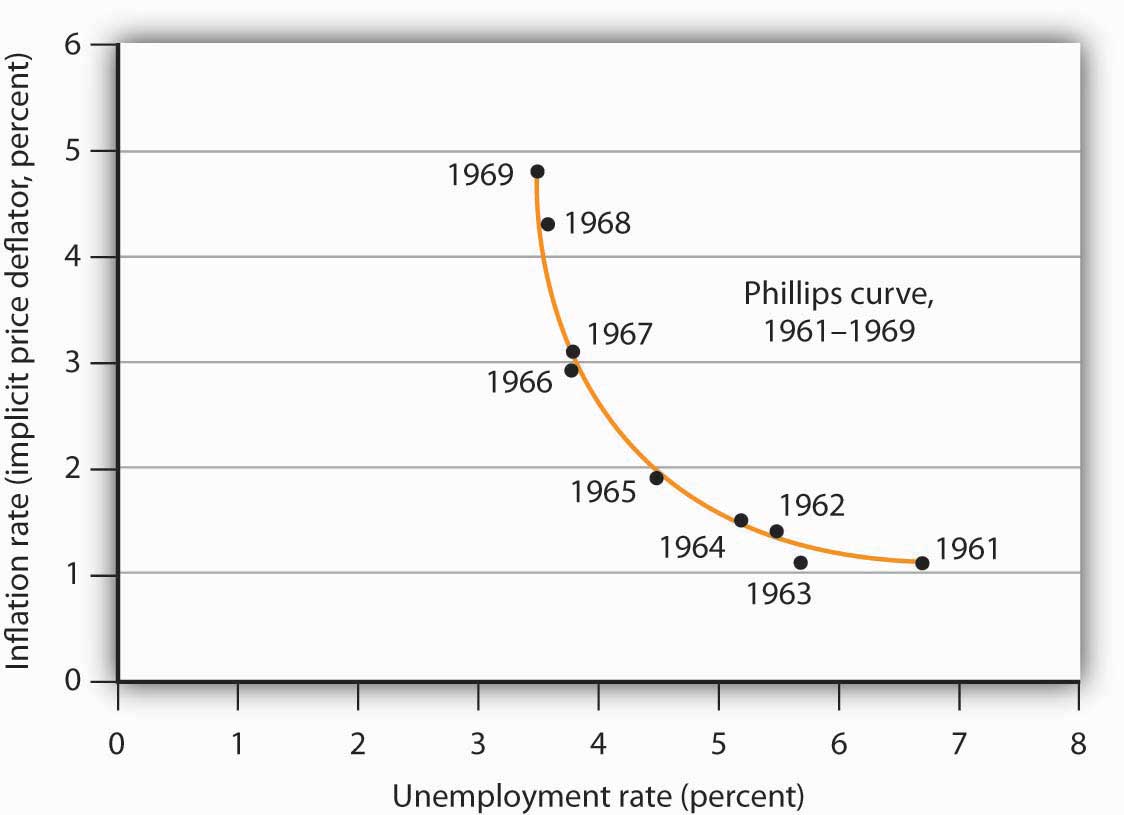
The Short-Run Phillips Curve in the 1960s
Inflation–Unemployment Phases
An economy may move from a Phillips phase to a stagflation phase and then to a recovery phase. The theory behind the Phillips curve did not hold true during the 1970s when global oil shocks threw the economy into stagflation – a simultaneous increase in prices and unemployment.
The figure shows the way an economy may move from a Phillips phase to a stagflation phase and then to a recovery phase.
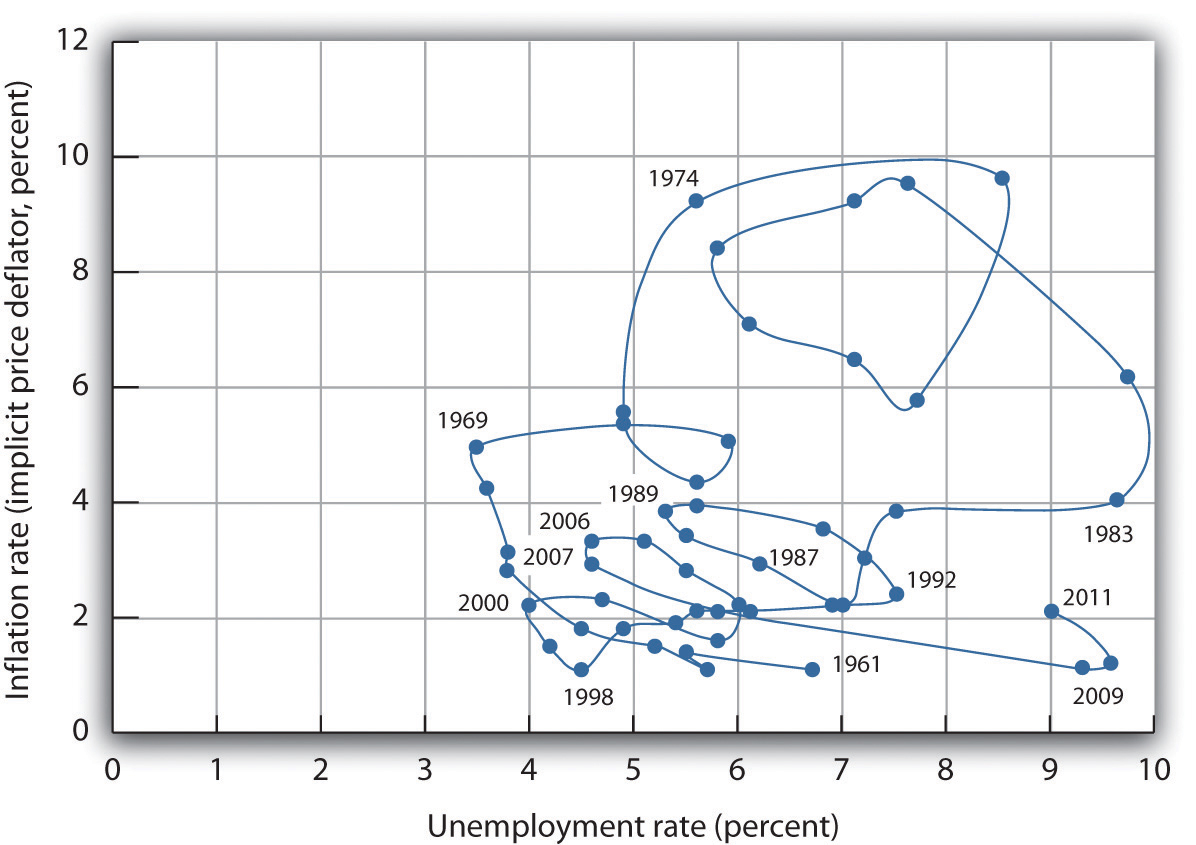
Connecting the Points: Inflation and Unemployment
Inflation–Unemployment Phases
3l. Describe and analyze the Classical as well as the Keynesian views on unemployment
According to classical economic theorists, free markets will automatically adjust to clear any disequilibrium that occurs in the labor and product markets. Governments do not need to intervene to help an economy recover from any negative shocks. Many economists disagree. For example, they argue that this theory does not explain why so many countries are plagued by sustained unemployment that lingers after a recession has ended (a period of disequilibrium).
John Maynard Keynes (1883–1946), a British economist, argued that wage and price stickiness or rigidity can cause disequilibrium, to allow an economic downturn to persist for an extended period of time. Government intervention is needed to push aggregate demand toward recovery.
To review classical and Keynesian economic theory, see Classical–Keynesian Controversy.
3m. Discuss various explanations for wage and price stickiness
- Identify factors that lead to wage and price stickiness? (For example, think about the role employment contracts play for maintaining a fixed wage.)
- Identify how each of the following helps explain wage stickiness:
- Efficiency wage theory;
- Implicit contracts theory;
- The adverse selection of wage cuts argument;
- The insider-outsider model of the labor force;
- The relative wage coordination argument.
Prices and wages often fail to adjust quickly to changes in the economic environment. As Keynes argued, sticky wages and sticky prices can contribute to sustained periods of economic divergence from long-run equilibrium. We review the mechanism of price adjustments in more detail in Unit 4.
To review sticky wages and sticky prices, see Aggregate Demand and Aggregate Supply and Unemployment.
Unit 3 Vocabulary
- Adverse selection of wage cuts argument
- Base year
- Basket of goods and services
- Consumer price index (CPI)
- Core inflation index
- Cost-of-living adjustment (COLA)
- Cost-push inflation
- Cyclical unemployment
- Deflation
- Demand-pull inflation
- Discouraged workers
- Efficiency wage theory
- Employed
- Employment cost index
- Frictional unemployment
- Full employment
- GDP deflator
- Hidden workers
- Hyperinflation
- Implicit price deflator
- Implicit contract
- Index number
- Indexed
- Inflation
- Insider-outsider model
- International price index
- Labor force
- Natural rate of unemployment
- Out of the labor force
- Phillips curve
- Phillips phase
- Producer price index (PPI)
- Quality/new goods bias
- Recovery phase
- Relative wage coordination argument
- Stagflation phase
- Structural unemployment
- Substitution bias
- Underemployed
- Unemployed
- Unemployment rate